
A comparison table for vector and graph databases
Because "just ask Claude" stopped working after the third follow-up

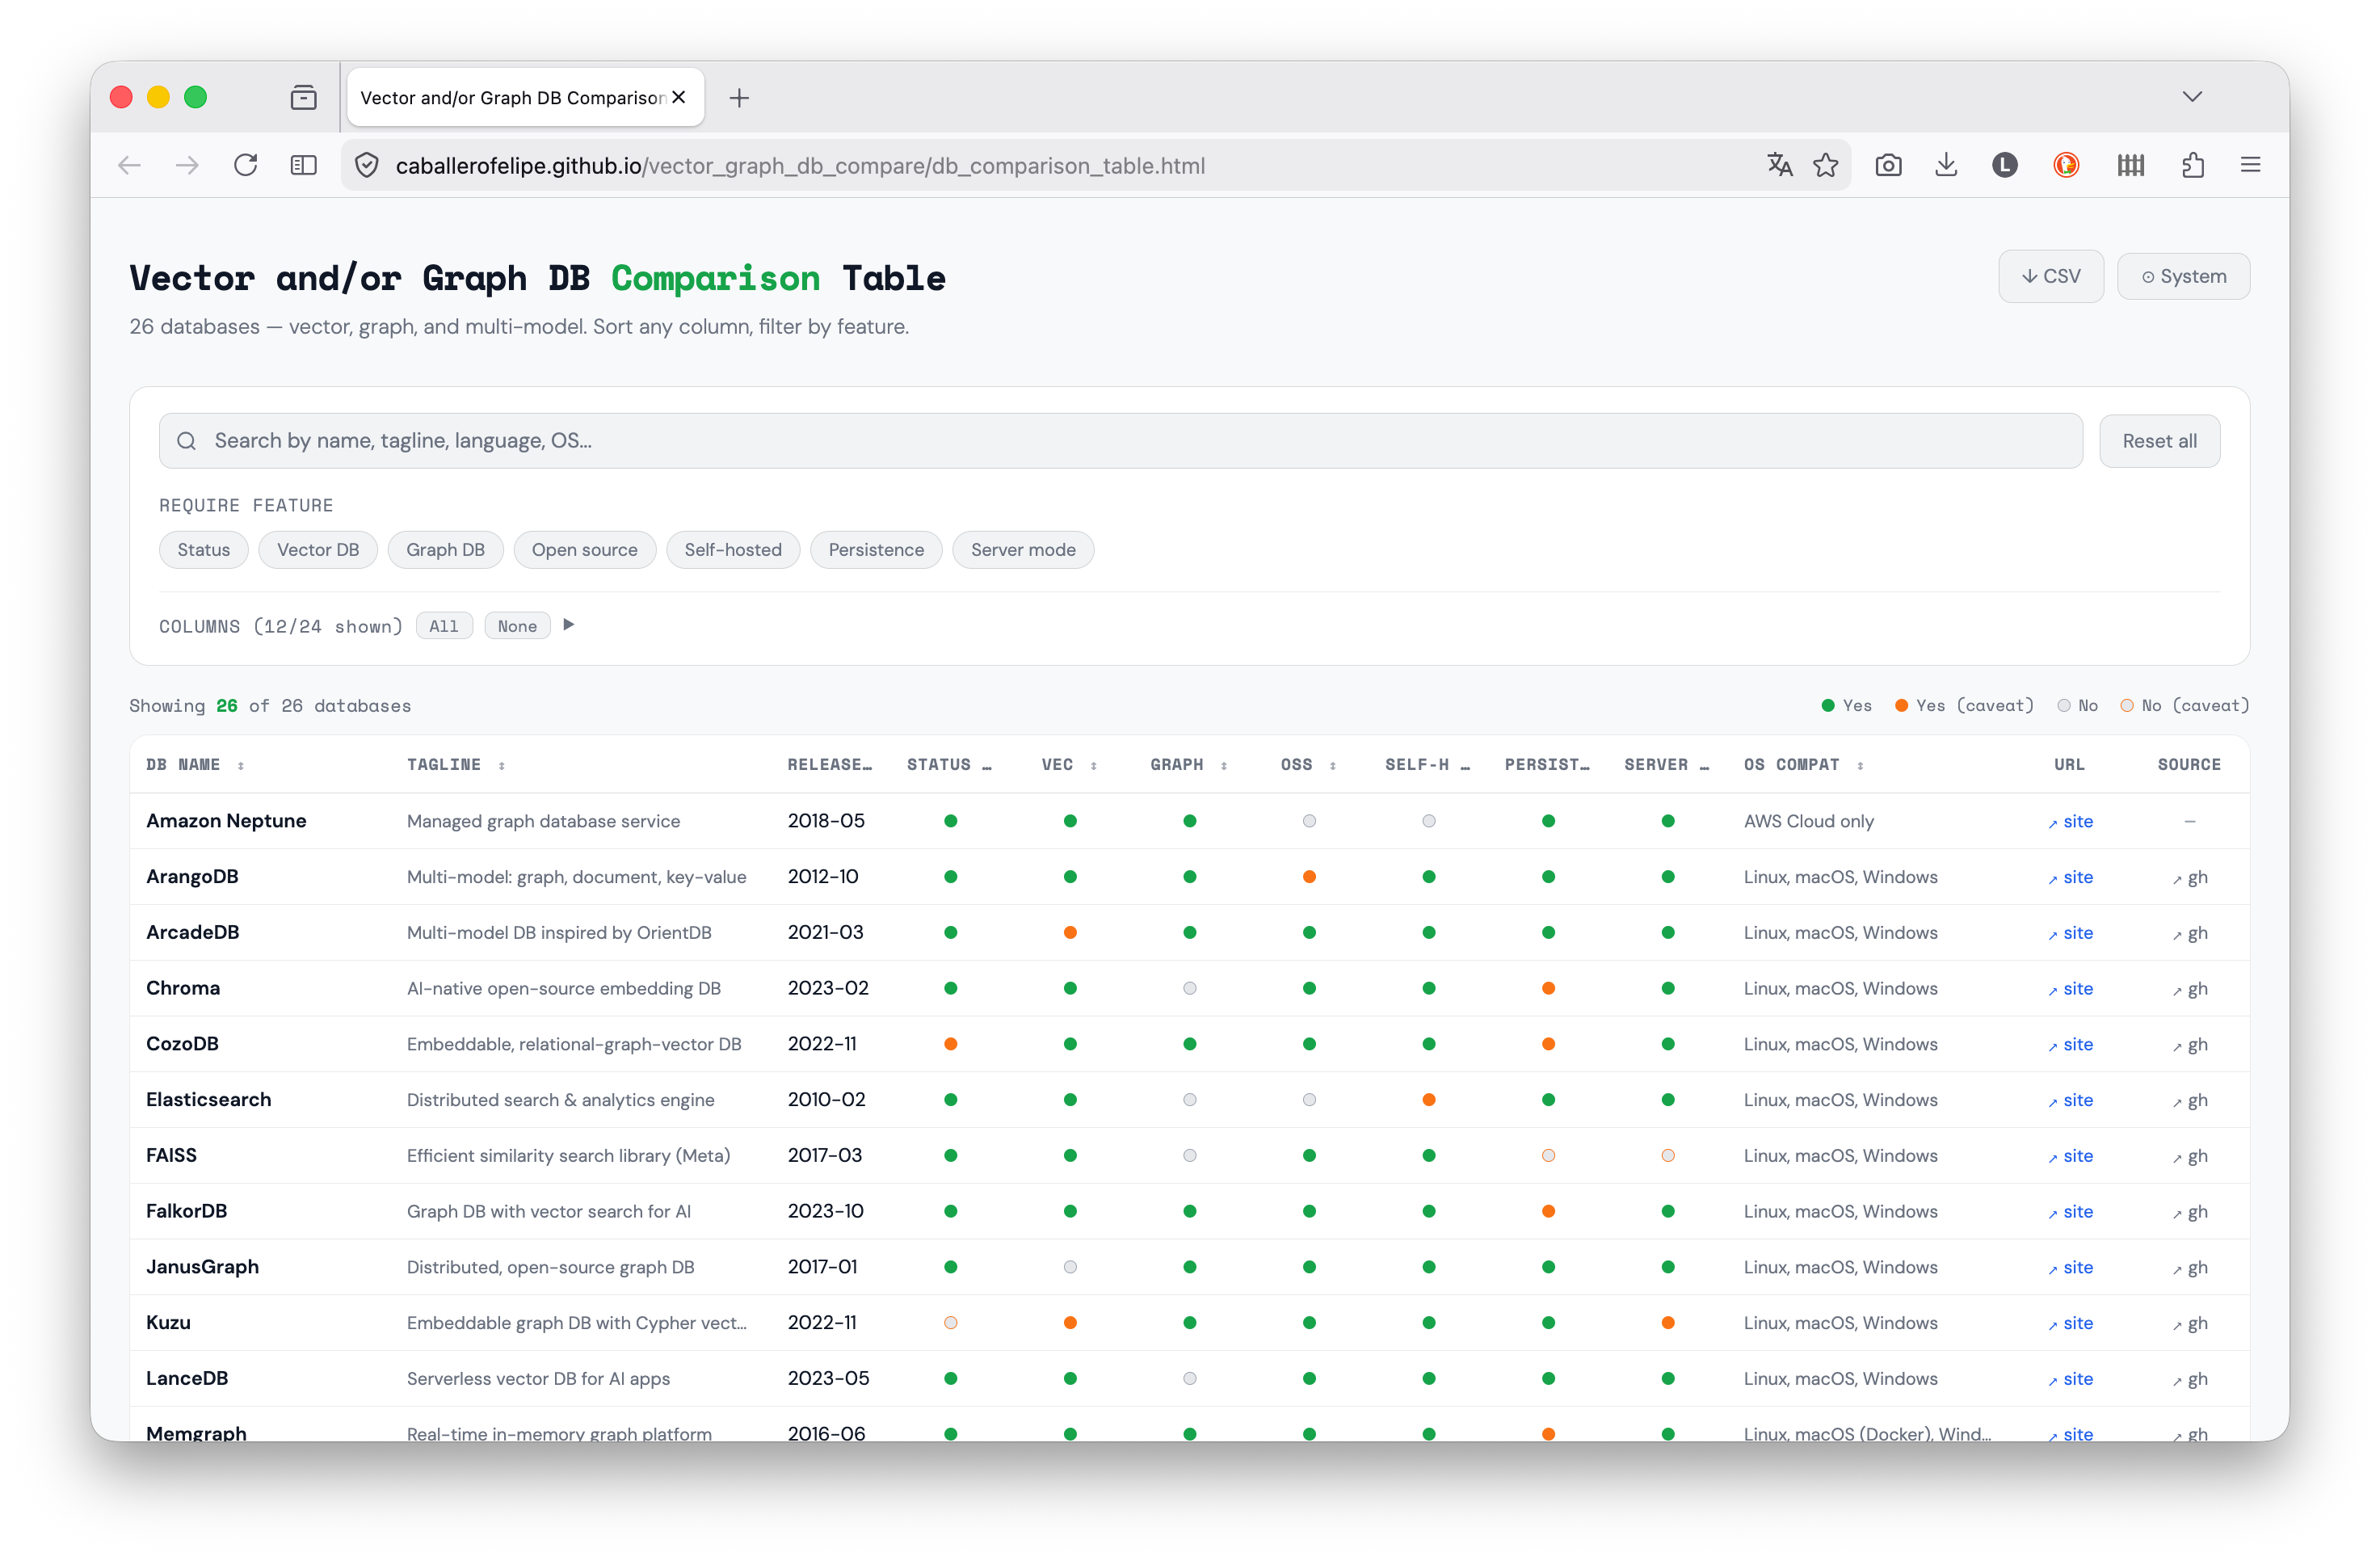
I needed to pick a database. I’m working on a project that requires both semantic search and relationship traversal, and I wanted to understand the landscape before committing. I tried figuring it out with Claude but that conversation quickly became huge (and token-consuming!). So I built a comparison table: direct link or see the repo. Figured it might be useful to others too.
Why I built this
I’m not very experienced with these kinds of databases, so I kept asking: what features do I need? And once I learned about a feature that seemed useful, like the embeddable column in the table, which turned out to be exactly what I wanted, I wanted to know which databases had it.
My conversation cycle with Claude.ai was: what DB should I use? → which features does it have? → do I need them? → what other DBs have them? This became painful quickly and very verbose. I needed a summary, not a lecture.
So I made something where I could select which features matter to me and filter by them: that’s where the three-state filter comes in; require a feature, exclude it, or ignore it.
Why vector and graph together?
These two paradigms solve related but distinct retrieval problems:
Vector databases store high-dimensional embeddings and find items by semantic similarity. They answer questions like “what is most similar to this?” using approximate nearest-neighbor search. Essential for RAG pipelines, recommendation systems, and any task that starts with an embedding model.
Graph databases store explicit relationships between entities and traverse them efficiently. They answer questions like “what is connected to this, and how?” using traversal algorithms. Essential for knowledge graphs, fraud detection, and anything where the structure of relationships matters.
Many real problems need both. A knowledge graph enriched with embeddings can answer “find documents semantically similar to this concept, then traverse the graph to find related entities.”
What the comparator covers
The table covers 26 databases across three categories: vector-only, graph-only, and multi-model. For each one, it tracks:
Core capabilities: native vector search, native graph support, whether it supports Cypher (the de facto graph query standard)
Ecosystem integration: LangChain and LlamaIndex support (LC/LI), since these are the dominant frameworks for building LLM applications
Operational factors: supported languages, deployment model, open-source vs. managed
Status: whether the project is actively maintained (using a six-month freshness window on public GitHub activity)
A caveat system: Many columns are boolean (yes or no). But a plain yes/no often lies. A database might “support” a feature behind a paid tier, in beta, or only via a third-party plugin. The table uses a caveat system: cells can be marked yes-with-caveat or no-with-caveat, and hovering reveals the nuance. This turned out to be useful because it allows you to filter and then check if what was filtered still applies to your needs.
Design decisions
The comparator is a static HTML file, no server, and no dependencies beyond Google Fonts. I wasn’t looking to do something dynamic on the server side, I just wanted to visualize things in an easy way. So...
Data lives in a .js file, not a database. The comparison data is a CSV string embedded in db_comparison_data.js. This makes it trivial to update, edit one file, reload the browser. No schema migrations, no API calls, no build pipeline. With this structure you can use this locally (i.e. file:///).
No build step. The whole point is that someone can clone the repo, double-click the HTML file, and immediately have a working table. Introducing a build step (a bundler, a framework) would add friction for zero benefit given the scale of the project.
Boolean caveats baby. Rather than forcing every feature into a yes/no, the data model supports optional caveat text for both the “on” and “off” states of any boolean column. This lets the table be precise without being verbose, and the nuance is available on hover.
Filters are three-state. Feature filter pills cycle through: no filter → require this feature → exclude this feature. This makes it easy to narrow the list to databases that have a specific capability, or to quickly exclude databases that lack one.
How to use it
The easiest way is to go to: https://caballerofelipe.github.io/vector_graph_db_compare/db_comparison_table.html
The second easiest is to clone the repo and open db_comparison_table.html in the browser.
Or, a little overkillish, go directly to the repo:
git clone https://github.com/caballerofelipe/vector_graph_db_compare
# Then open db_comparison_table.html in a browser
# Or serve locally if your browser restricts file:// scripts:
python3 -m http.server 8765
Visit http://localhost:8765/db_comparison_table.html. Use the feature pills to filter by capability, the search box to narrow by name or language, and the column visibility controls to focus on what matters for your use case. The CSV export gives you the full dataset for further analysis.
To update the data or add a database, edit db_comparison_data.js only.
Take it with a grain of salt
I obtained data for 26 DBs, cross-checking docs, release notes, and GitHub activity with the help of Claude and Cursor. AI-assisted research speeds things up (a lot!) but it also hallucinates, so take individual cells with a grain of salt; the table links to each database’s official site so you can verify anything that matters to you.
This is a vibe coded snapshot, not an authoritative spec sheet. It reflects how each system presents itself as of early 2026 (features change, projects get abandoned). Verify on the vendor’s site before making any real decision.